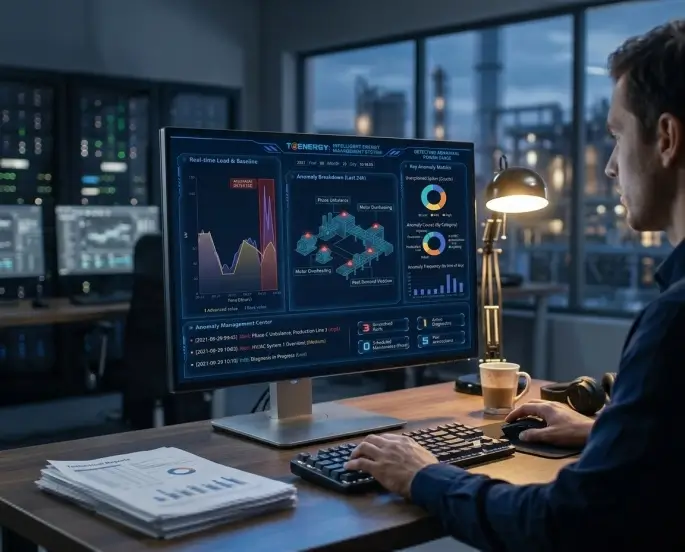
The electricity consumption of industrial enterprises is more complex, and power management is often relatively chaotic. Identifying abnormal electricity consumption is therefore a major challenge for enterprise managers. Some abnormal consumption may be caused by equipment failures, some by special production requirements, and a significant portion may result from human habits, such as forgetting to turn off equipment after work.
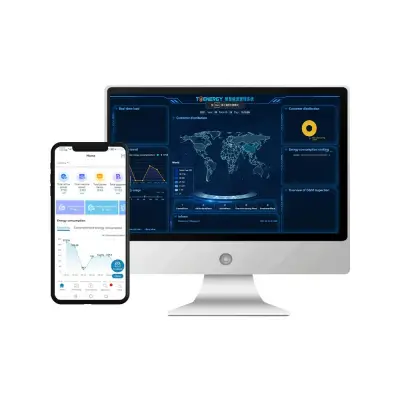
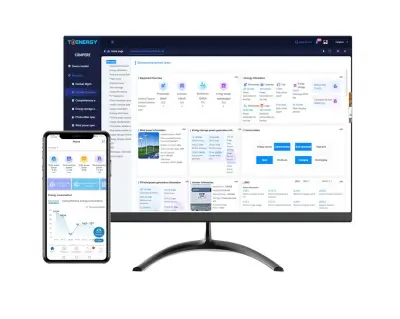
So, is there an effective way to quickly identify abnormal electricity consumption? The following case study demonstrates how the “Operational Analysis” function of the T@ENERGY energy management system can be used to detect abnormal electricity consumption during non-working hours.
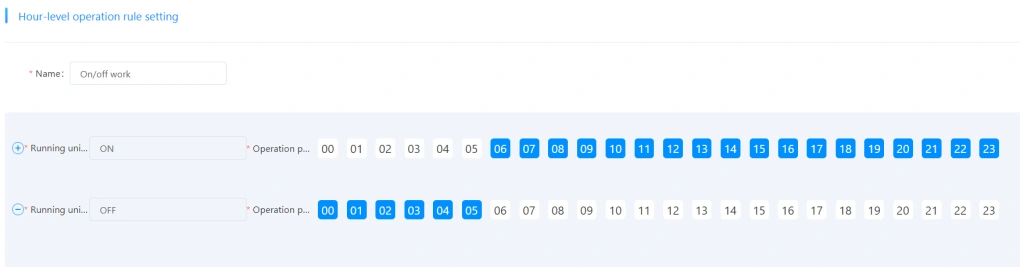
Step 1: Set Up Statistical Rules
Based on the actual working hours of the enterprise, set different energy usage analysis time periods. Multiple statistical rules can also be created according to operational requirements.
For example, in this case the working hours were set from 6:00 AM to 12:00 AM, while off-hours were defined as 12:00 AM to 5:00 AM.
Step 2: Observe Data Changes
In the “Consumption Unit – Operational Analysis” module, select the daily data option and observe the energy consumption trends over the past week. This step helps identify patterns or unusual fluctuations in electricity usage.
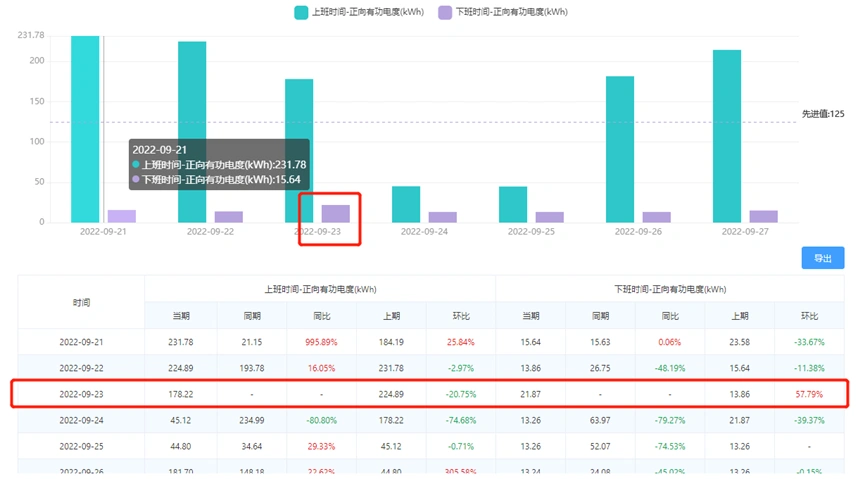
Step 3: Identify Outliers
Using histograms and data charts, the system revealed that the energy consumption during non-working hours on September 23rd was significantly higher than the weekly average. This abnormal spike immediately indicated a potential issue.
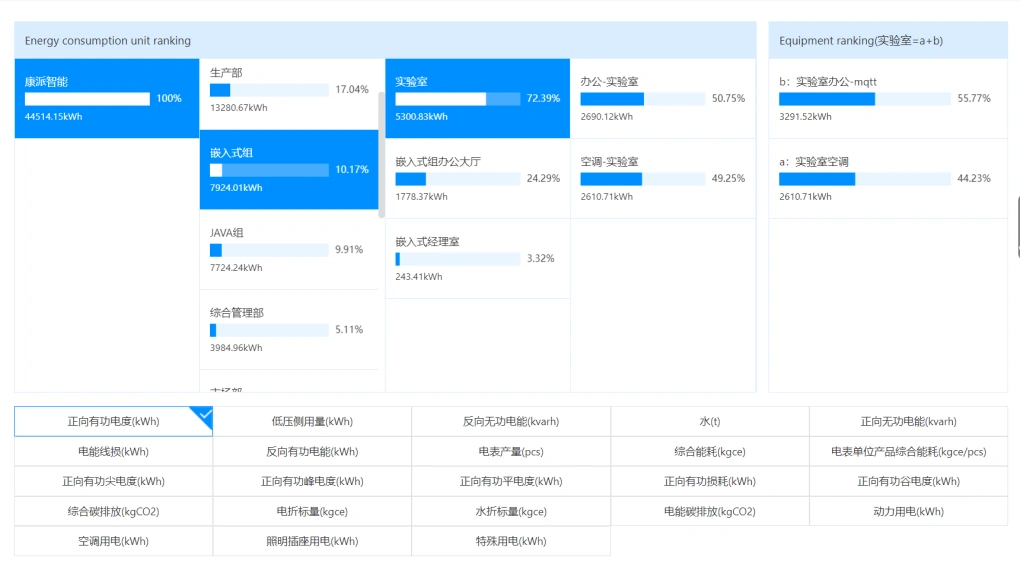
Step 4: Trace the Source of the Abnormality
By comparing the changes in energy consumption rankings between two days, the abnormal energy consumption area was quickly identified. The Embedded Systems Team in the R&D department ranked 4th in energy consumption on September 22nd but rose to 2nd on September 23rd, increasing by approximately 5 kWh.
Further comparison showed that the laboratory energy consumption of the embedded systems team increased by about 6 kWh compared to the previous day. Detailed analysis revealed that the laboratory air conditioning system alone accounted for the 6 kWh increase. This suggested that the air conditioning had not been turned off during non-working hours.
Step 5: Confirm the Abnormal Energy Consumption
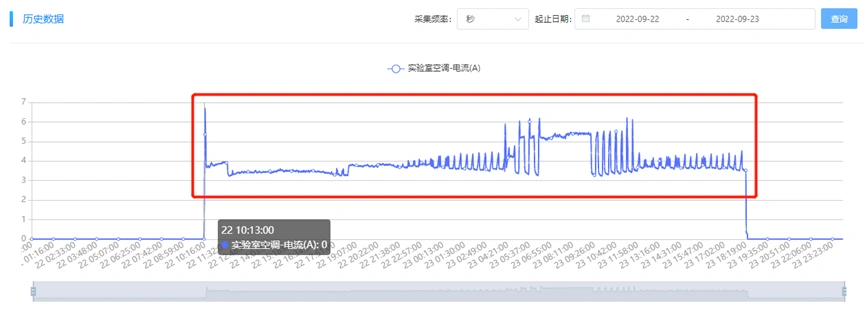
Through the “Energy Consumption Monitoring – Historical Data” module, the abnormal energy consumption node was further verified. The data confirmed that the excessive energy usage on September 23rd was caused by the “Embedded Systems Team – Laboratory – Air Conditioning” equipment remaining switched on.
After extracting the data from September 22nd to September 23rd, it was found that the air conditioning in the R&D laboratory had been turned on at 10:00 AM on September 22nd and was not turned off until 5:35 PM on September 23rd.
Step 6: Identify the Responsible Party
Once the issue was confirmed, the enterprise could assign responsibility according to its internal management policies. In this case, the person responsible for the laboratory was notified to prevent similar situations in the future.
Summary: From Reactive Leak Detection to Proactive Energy Saving
1. Achieving Granular Energy Consumption Management
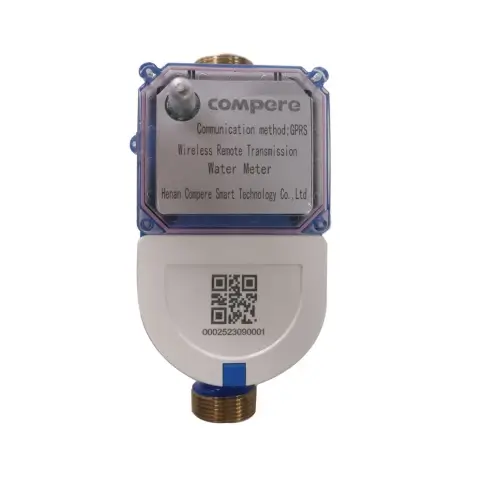
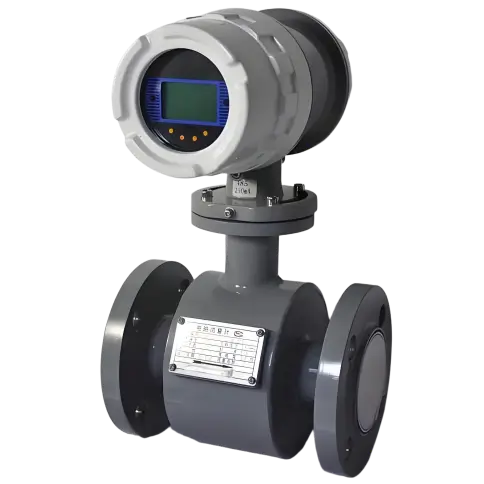
Traditional smart energy meters only provide total energy consumption data. In contrast, an energy management system breaks data down by both time (period analysis) and space (equipment nodes). This granular visibility makes it easier to detect energy waste caused by human habits and allows companies to move from broad energy-saving campaigns to precise, targeted improvements.
2. Establishing a Routine Monitoring Mechanism
With digital monitoring, anomaly detection no longer relies on manual inspections. The system can monitor energy consumption 24/7 and send alerts when thresholds are exceeded, enabling companies to intervene early and prevent long-term energy waste.
3. Building a Data-Driven Management Closed Loop
The historical trends and ranking comparisons generated by the system provide objective evidence for enterprise performance evaluation. Energy management is therefore elevated from simple technical operation and maintenance to an important part of corporate governance, where equipment fault detection, production demand analysis, and behavioral management are all integrated through transparent data.