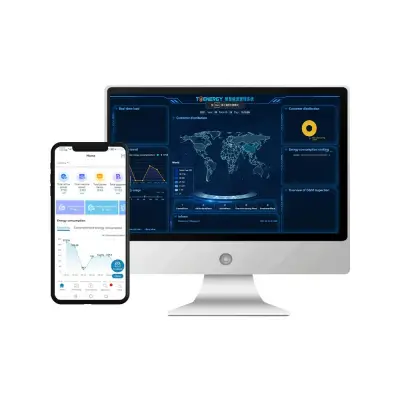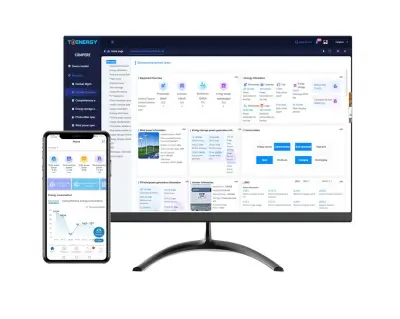
The energy management system can automatically generate corresponding visualized data reports and graphs according to different time and regional dimensions, displaying the changing trends of various energy consumption data in the factory over different time periods. The data is clear, intuitive, and easy to understand.
It helps factory users clearly understand their basic electricity consumption situation, understand energy consumption patterns, and thus identify various problems in the energy consumption structure and process. It also provides solutions and suggestions for improving and optimizing the factory’s energy consumption structure and methods.
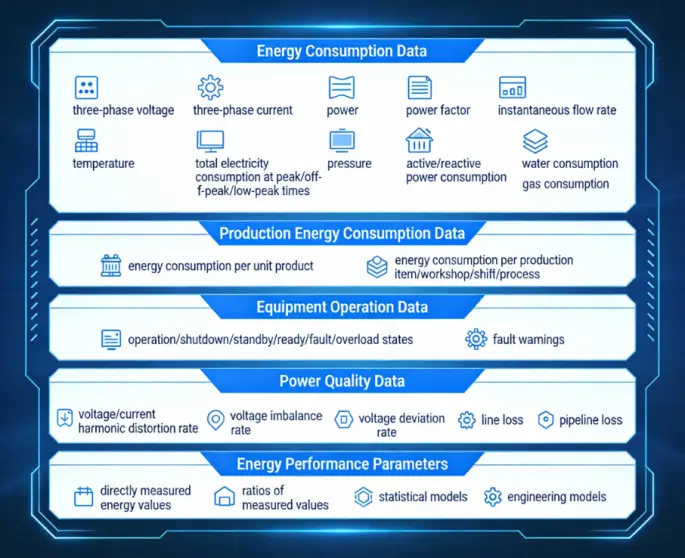
1. Energy Consumption Data
This includes real-time and quantity data on energy consumption. Real-time data includes parameters such as three-phase voltage, three-phase current, power, power factor, instantaneous flow rate, pressure, and temperature. Quantity data includes total electricity consumption at peak, off-peak, and low-peak times, active and reactive power consumption, water consumption, and gas consumption.
2. Production Energy Consumption Data
- (1). This includes real-time and historical energy consumption information for each production item, workshop, shift, and key production process, including comprehensive energy consumption per unit product and comprehensive electricity consumption per unit product.
- (2). By simply entering the output of each product into the energy management system, the system automatically calculates and displays the energy consumption curve and data for that product. This provides factory managers with insights into the changing trends in energy consumption for each product, aiding in cost accounting and enabling reasonable adjustments to production plans. The system also tracks the electricity consumption of each shift on the production line, providing data support for shift energy planning, production scheduling, and shift time adjustments to optimize production management processes and maintain unit energy consumption and energy efficiency at a scientific and reasonable level.
3. Equipment Operation Data
- (1). Monitor the operation status of major energy-consuming equipment, including operation, shutdown, standby, ready, fault, and overload states.
- (2). When energy-consuming equipment experiences abnormal conditions such as voltage loss, phase loss, overpower operation, or abnormal power consumption, the energy management system can issue timely warnings and automatically close the circuit breaker to help factory personnel promptly identify and resolve problems, improve energy safety within the factory, and effectively extend the service life of equipment.
4. Power Quality Data
- (1). Includes voltage and current harmonic distortion rate, voltage imbalance rate, voltage deviation rate, line loss, and pipeline loss.
- (2). The energy management system can automatically analyze the potential fault factors caused by high voltage, current, and power, ensuring a safe operating environment for equipment within the factory. The system can calculate line loss values and compare them with theoretical line loss values to identify nodes with high line loss and reduce losses. The system can analyze the pipeline loss of different energy pipelines such as water and gas pipes, helping managers to promptly troubleshoot and resolve problems.
5. Energy Performance Parameters
- (1). Energy performance parameters include directly measured energy values, ratios of measured values, statistical models, and engineering models. 1. Directly measured energy values;
- (2). Directly measured energy values: electricity consumption, gas consumption, coal consumption, etc.;
- (3). Ratios of measured values: comprehensive energy consumption per unit product, comprehensive energy consumption per unit area, comprehensive energy consumption per unit of industrial added value, per capita energy consumption, etc.;
- (4). Statistical models: energy performance of equipment and facilities producing two or more types of products; energy performance of equipment with base load; energy performance of hotels with different occupancy rates and located in different climate zones; relationship between pump/fan energy consumption and working fluid flow rate;
- (5). Engineering models: engineering calculation or simulation models of industrial or power generation systems that can describe the relationships between variables; power consumption models of chiller units that can establish the relationship between cooling load, outdoor temperature (condensing temperature), and indoor temperature (evaporating temperature); building energy consumption models that can establish the relationship between operating time, air conditioning system type, and user needs;
Energy management systems, by establishing energy performance parameters and energy benchmarks, determine the measurement boundaries of each energy performance parameter, helping enterprises understand their energy consumption, energy efficiency, and potential energy-saving potential in real time. Energy performance parameters can be used to reduce energy consumption and waste, ensure equipment operating efficiency, improve energy performance, and meet all legal and regulatory requirements by taking effective corrective and preventive measures.